Forty-one sales show up in the Plantation Lakes report for the past year. Three of them are not houses. Here is what the other thirty-eight actually sold for, and the two patterns inside those numbers that decide what your home is worth.
Sales data as of September 17, 2026 · 38 closed home sales plus 3 land sales, 14 homes currently for sale · See the live Plantation Lakes market report
What a Plantation Lakes home is worth right now
Thirty-eight homes sold in Plantation Lakes in the twelve months to September 2026, and they closed between $500,000 and $1,550,000. The average was $792,339 and the median $724,131. Sellers collected about 96.4% of their final asking price, and half of them were under contract within roughly eighty days. That is the honest headline, and the rest of this article is about why the numbers underneath it matter more than the average does.
How I price and market a home here, before a number ever goes on the sign.
Three of the 41 sales in the report are not houses
Open the Plantation Lakes sold report, which runs the same tables with the active listings sitting above the closings, and the sold count reads 41. Three of those rows have no bedrooms, no bathrooms, no square footage and no year built, because they are vacant lots.
| Vacant lot | Sold price | Days on market |
|---|---|---|
| 0.70 acre | $235,000 | 108 days |
| 0.85 acre | $265,000 | 254 days |
| 0.89 acre | $245,000 | 162 days |
That matters for two reasons. The first is the floor. Left in the table, the cheapest Plantation Lakes sale of the year looks like $235,000, which is not a number any homeowner here should be anchoring to. Take the land out and the lowest price any house sold for was $500,000.
The second is the average itself. The report averages sale price across all forty-one rows and arrives at $752,534, but it averages square footage and price per square foot across only the thirty-eight properties that have any. The price figure and the size figure are not describing the same set of homes. Count only the houses and the average sale price is $792,339, about $40,000 higher than the published number.
Two-thirds of these homes were nearly the same size. They were not the same price.
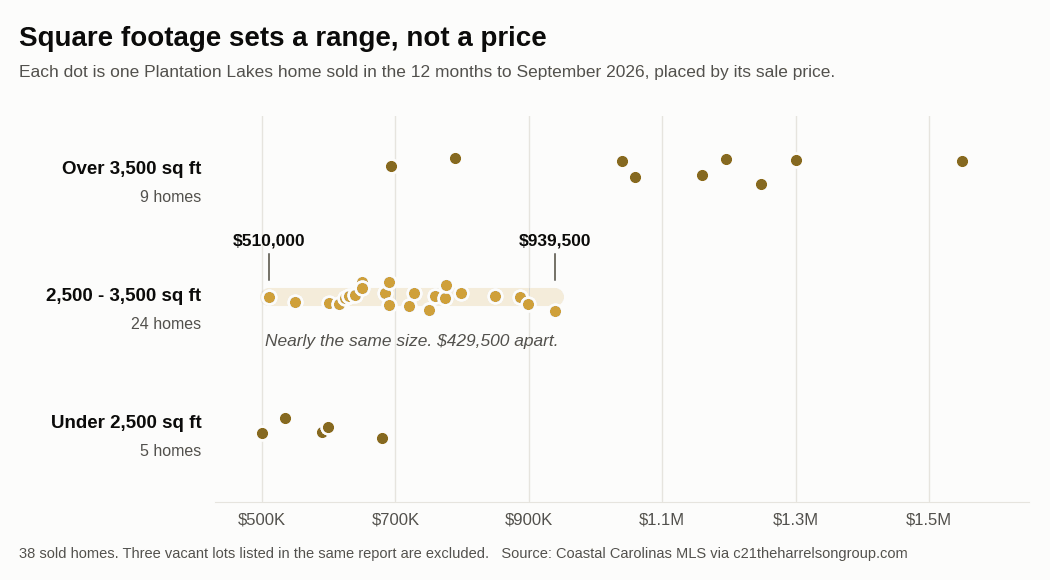
Twenty-four of the thirty-eight homes, close to two thirds of the market, measure between 2,500 and 3,500 square feet. If square footage set the price, those twenty-four would cluster. They do not. They run from $510,000 to $939,500, a spread of $429,500 across homes that a spreadsheet would call interchangeable.
Two pairs on this list make the point better than any average can. Each pair is matched to the square foot.

9048 Abingdon Dr.
Sold $510,000
4 beds · 4 baths · 2,519 sq ft · $202/sq ft · built 2012 · 0.28 acre lot
Listed at $515,000 and closed just under it after 352 days on the market, the longest run of any home on this list.
Listing courtesy of DR Horton.

2036 Woodburn Dr.
Sold $629,900
4 beds · 3 baths · 2,519 sq ft · $250/sq ft · built 2011 · 0.67 acre lot
The same 2,519 square feet, one year older, and it took the full asking price in 83 days. The difference is a lot more than twice the size.
Listing courtesy of Sands Realty Group Inc.

8504 Juxa Dr.
Sold $728,262
4 beds · 4 baths · 3,107 sq ft · $234/sq ft · built 2008 · 0.54 acre lot
Asked $765,000, waited 227 days, and settled $36,738 below it. The oldest home of the four and the one that negotiated hardest.
Listing courtesy of RE/MAX Southern Shores.

247 Welcome Dr.
Sold $939,500
4 beds · 4 baths · 3,107 sq ft · $302/sq ft · built 2022 · 0.27 acre lot
Identical square footage to the Juxa Drive home, on half the lot, built fourteen years later. It sold for $211,238 more in a third of the time.
Listing courtesy of RE/MAX Southern Shores.
At 2,519 square feet, Abingdon Drive sold for $510,000 and Woodburn Drive for $629,900, a gap of $119,900. There, the larger lot won. At 3,107 square feet, Juxa Drive sold for $728,262 and Welcome Drive for $939,500, a gap of $211,238. There, the smaller lot won, because the home on it was fourteen years newer.
That is the whole lesson. Lot size explains one pair and gets the other backwards. Much of Plantation Lakes was built one house at a time rather than in phases off a builder menu, so age, finish level, how the lot sits against the water and what has been replaced since move-in do the work that square footage cannot. Anyone pricing your home off a community-wide dollar per square foot is guessing with a confident face.
The clock was the same at every price. The discount was not.
| Sale price | Homes | Share of asking | Average given up | Median days | Per sq ft |
|---|---|---|---|---|---|
| $500,000 to $700,000 | 18 | 97.9% | $12,994 | 79 | $234 |
| $700,000 to $900,000 | 12 | 96.9% | $25,291 | 83 | $255 |
| $900,000 and above | 8 | 94.1% | $75,225 | 80 | $283 |
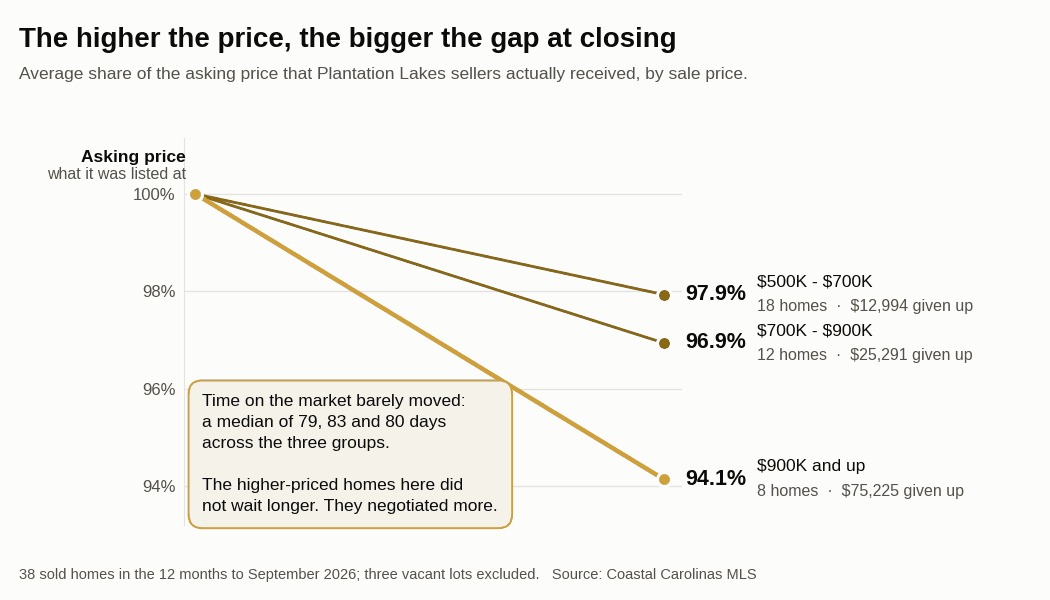
The natural assumption is that expensive homes take longer to sell. Here they did not. The median time to contract was 79 days under $700,000, 83 days in the middle, and 80 days above $900,000. Three groups, essentially one answer.
What changed was the size of the concession. Sellers under $700,000 gave up an average of $12,994 off their final asking price. Above $900,000 they gave up $75,225, close to six times as much. Only seven of the thirty-eight homes sold at or above the asking price, and the higher the number on the sign, the harder the buyer pushed back on it. If your home belongs in the upper tier, the negotiation is where your money is won or lost, not the calendar.
What this means if you are selling in Plantation Lakes
Start by throwing out the community average. Your home is not competing with thirty-seven other houses, it is competing with the three or four that genuinely resemble it: same era, comparable lot, similar position on the water, finishes in the same condition. Find those, put each sale price next to its final list price, and you will see exactly what buyers were willing to argue about.
Then be realistic about which tier you are in. If the number lands above $900,000, plan for a negotiation rather than a queue of offers, and price so that the negotiation starts from a defensible place instead of a hopeful one. None of this tells you what your house is worth, though. It tells you where the range sits and where the arguments happen. The rest depends on things no table records, and that part takes an hour inside the house.
Now the part that is my job: I sell homes in Plantation Lakes, and what that is worth to you here is knowing which closings are a real comparison for your house and which ones only look like one. Two homes on this list are identical to the square foot and sold $211,238 apart. Pull the wrong one into your pricing conversation and you will either leave six figures on the table or spend a year discovering the number was never there. I can tell you which of these thirty-eight sales your home actually belongs beside, and why the rest of them do not.
Here is the uncomfortable part of that promise: you cannot audit my reasoning from the outside. Every agent who sits at your table will arrive with comparable sales, and in a community where the same square footage sold more than $200,000 apart, the choice of comparison is the entire argument. So I hand you the test instead of asking for faith. My listings run on the Easy Exit Listing Agreement, which carries a one-day listing guarantee and no long-term contract. If you are not completely satisfied, you say so and we are done. You do not have to be right about me on the first day. You only have to watch what happens after it.
Thinking about selling in Plantation Lakes?
Start with an instant figure from the home value estimator, then let me walk the house and tell you which of the closings above your home really belongs next to. If you are further out, the sell your home timeline lays out what happens and when.
Key Takeaways
| What the report shows | What it actually means |
|---|---|
| The report says 41 sales | Three of them are vacant lots. Thirty-eight houses actually changed hands, and not one of them sold below $500,000. |
| The report says the average is $752,534 | Strip the land out and the homes averaged $792,339, with a median of $724,131. The published average is about $40,000 light because it counts land the size figures ignore. |
| Square footage looks like the answer | Twenty-four of the thirty-eight homes fall between 2,500 and 3,500 square feet, and inside that band prices run from $510,000 to $939,500. Two homes matched to the square foot sold $211,238 apart. |
| A higher price looks like a longer wait | It was not. The median was 79, 83 and 80 days across the three price groups. What changed was the discount: 97.9% of asking under $700,000, and 94.1% above $900,000. |
Frequently Asked Questions
What is the average home price in Plantation Lakes?
The thirty-eight homes that closed in the twelve months to September 2026 averaged $792,339, and the median was $724,131. The market report itself shows a lower average, $752,534, because three vacant lots are counted in the same table. Whichever figure you use, the range behind it runs from $500,000 to $1,550,000, so the average is a poor guide to any particular house. The live Plantation Lakes market report keeps the current numbers.
Why does the Plantation Lakes sold report show a sale at $235,000?
That sale is a vacant lot, not a house. Three of the forty-one closings in the report are land: roughly seven tenths to nine tenths of an acre, sold at $235,000, $245,000 and $265,000, with no bedrooms, bathrooms or square footage recorded. No house in Plantation Lakes sold below $500,000 during the period.
How long does it take to sell a home in Plantation Lakes?
Half of the thirty-eight homes sold within about eighty days of being listed. The average is longer, near 116 days, because a handful of homes ran past 340 days and pull it up. Time on the market was remarkably flat across price: the median was 79 days under $700,000, 83 days between $700,000 and $900,000, and 80 days above $900,000.
Do larger homes in Plantation Lakes sell for more per square foot?
They did over this period. Homes that sold between $500,000 and $700,000 averaged about $234 per square foot, those between $700,000 and $900,000 about $255, and those above $900,000 about $283. That is the opposite of what people often expect, and it is one reason a community-wide price per square foot should not be used to price an individual home here.
What schools serve Plantation Lakes?
Addresses inside Plantation Lakes are zoned for Ten Oaks Elementary, Ten Oaks Middle School and Carolina Forest High School for the 2025 to 2026 year. Attendance zones can change, so confirm your specific address with Horry County Schools before you rely on it.
What are the HOA dues in Plantation Lakes?
There is no single figure. Dues vary by section and by what the lot includes, and the recent sales carried monthly amounts ranging from about $122 to $150. Rather than quote one number, check the HOA Fees (Calculated Monthly) line on the detail page of the specific listing you are looking at. Dues generally cover the amenity center, the two pools, common area landscaping, the entrance, trash removal and an overnight security patrol.
Where is Plantation Lakes?
Plantation Lakes sits in the Carolina Forest area of Horry County, with Myrtle Beach mailing addresses and a large boatable lake at its center. Horry County records the subdivision at roughly 700 acres, and it lies about four to five miles inland from the oceanfront depending on which end of the community you measure from. You can browse everything for sale in Carolina Forest or read the Carolina Forest real estate guide.
About Greg Harrelson
Greg Harrelson is a seasoned Realtor® with more than 30 years of experience serving the Myrtle Beach and Grand Strand markets. As the founder of Century 21 The Harrelson Group, Greg has built his career helping buyers, sellers, and investors achieve success in every corner of the coastal Carolina real estate market. His expertise spans residential homes, investment properties, land development, and coastal condos. Known for his deep local knowledge, innovative marketing strategies, and commitment to personal service, Greg consistently helps clients reach their real estate goals while navigating the ever-changing market with confidence and precision.
Provided courtesy of The Coastal Carolinas Association of REALTORS®. Information Deemed Reliable but Not Guaranteed. Copyright 2026 of the Coastal Carolinas Association of REALTORS® MLS. All rights reserved. Information is provided exclusively for consumers’ personal, non-commercial use, that it may not be used for any purpose other than to identify prospective properties consumers may be interested in purchasing.